GBP/USD Price Analysis: 100-SMA tests bears below 1.2500
- GBP/USD remains depressed around two-week low, sidelined of late.
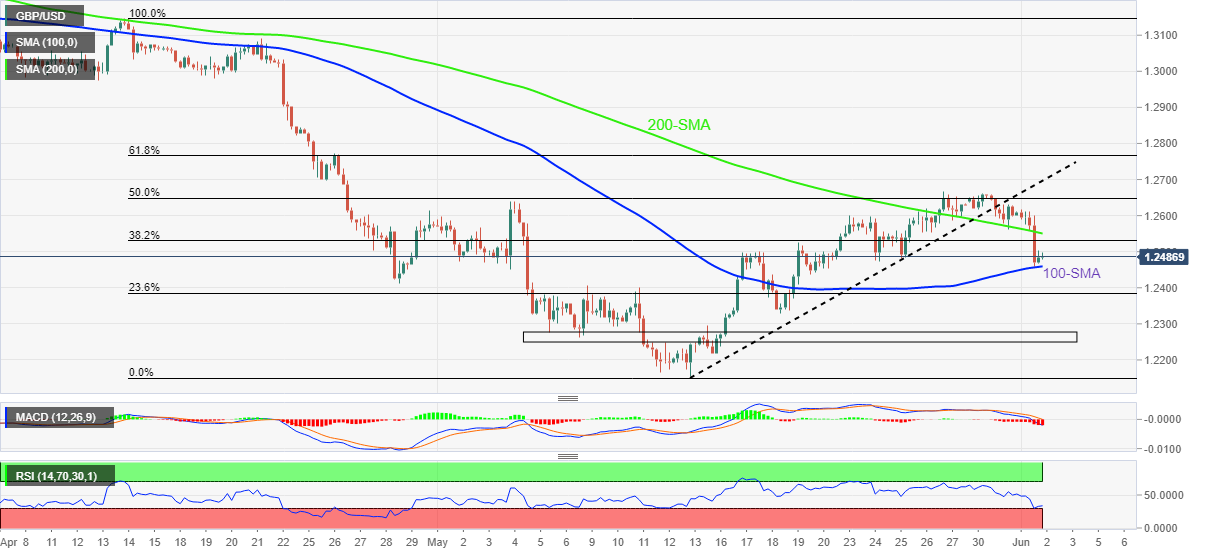
- Clear downside break of short-term key support, 200-SMA keep sellers hopeful.
- RSI conditions, 100-SMA restrict immediate downside ahead of the multi-month low marked in May.
GBP/USD licks its wounds around a fortnight low, after dropping the most in two weeks, as the 100-SMA probes the downturn during Thursday’s Asian session. Even so, the cable pair stays pressured around 1.2480-80 levels by the press time.
Although nearly oversold RSI (14) joins the 100-SMA to challenge the pair sellers around 1.2460, bearish MACD signals and sustained trading below 200-SMA keep sellers hopeful.
Also favoring the bears is the pair’s downside break of an ascending support line from May 13, now resistance around 1.2700.
It’s worth noting, however, that multiple supports around the 23.6% Fibonacci retracement (Fibo.) of April-May fall could challenge the GBP/USD bears around 1.2385, even if the quote drops below the 100-SMA level of 1.2460.
Following that, a broad one-month-old horizontal area surrounding 1.2275-55 will be a tough nut to crack for the pair sellers.
On the contrary, recovery moves could initially aim for the 200-SMA and May’s peak, respectively around 1.2550 and 1.2670, before targeting the support-turned-resistance line near 1.2700.
Should the GBP/USD bulls manage to keep reins past 1.2700, the 61.8% Fibonacci retracement level of 1.2765 will be in focus.
GBP/USD: Four-hour chart
Trend: Further weakness expected