GBP/USD Price Analysis: Risks further falls, with triangle breakdown in play
- GBP/USD breaches the 1.3850 level as Bailey backs more QE.
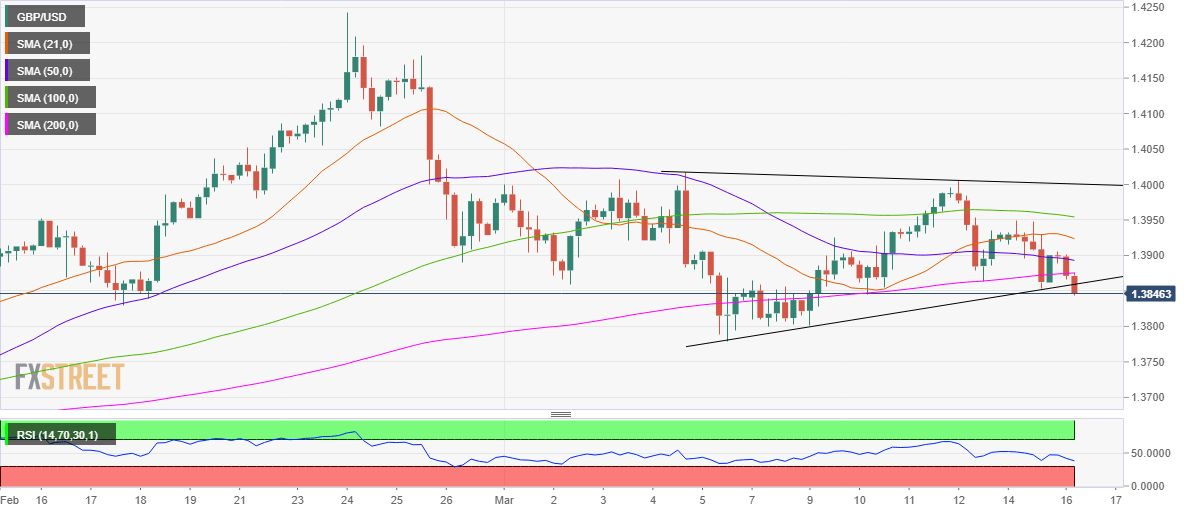
- The 4H chart spots a potential symmetrical triangle breakdown.
- RSI points south below the midline, US data awaited.
GBP/USD has come under heavy selling pressure after the Bank of England (BOE) Governor Andrew Bailey said that the central bank will continue bond purchases this year.
The spot accelerated its retreat from the 1.3900 level, as the bulls now look to test the 1.3800 threshold. The recovery in the US Treasury yields limits the dollar’s decline adding to the weight on the cable.
Investors look forward to the US Retail Sales release for near-term trading opportunities in the major.
Technically, as observed on the four-hour chart, the price is teasing a symmetrical triangle breakdown, with the pattern likely to get validated on a candlestick closing below the rising trendline resistance at 1.3859.
The next level for the sellers would be seen at the psychological 1.3800 level, below which the March low at 1.3779 will get tested.
The relative strength index (RSI) points south towards the oversold region while below the 50 level, allowing room for more declines.
GBP/USD: Four-hour chart
On the flip side, the abovementioned pattern support now resistance will offer initial resistance.
Further up, the bullish 200-simple moving average (SMA) at 1.3875 could challenge the bulls’ commitments.
All in all, the path of least resistance appears to the downside.
GBP/USD: Additional levels