NZD/USD meeting resistance around 0.72 the figure
- NZD/USD bulls are testing the commitments of the bears around the 0.72 area.
- The bias is bearish on the weekly and daily charts ahead of the FOMC this week.
As per this week's, The Watchlist: NZD/USD and EUR/JPY in focus for the open, the price of the bird is lacking conviction on the bid in a subdued start ahead of a busy schedule on the calendar.
At the time of writing, NZD/USD is trading at 0.7194 and was 0.7116 at its highest for Monday, but below the 0.72 figure throughout London and New York.
The Federal Open Market Committee meeting will be the focus for the week.
In particular, there will be ''potential for the so-called dot plots (representing each Fed voter’s interest rate expectations) and growth forecasts to drift higher, potentially lending the USD a hand.,'' analysts at ANZ Bank explained.
''The NZD story is a good one, and Gross Domestic Product data on Thursday will be telling, but we’ve had our big rebound, whereas the US’s it is yet to come, fuelled by fiscal support and vaccines.''
NZD/USD technical analysis
In the prior analysis at the start of the week, a bearish bias was illustrated from the weekly and daily charts as follows:
NZD/USD weekly chart
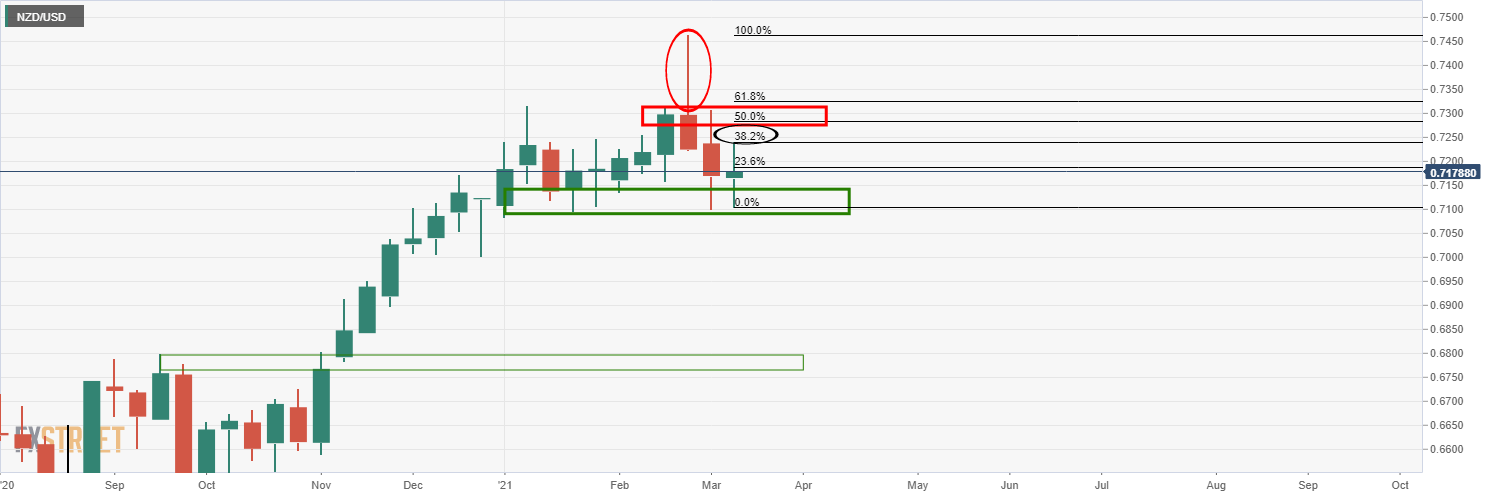
The weekly chart is bearish according to the strong rejection candle.
NZD/USD daily chart
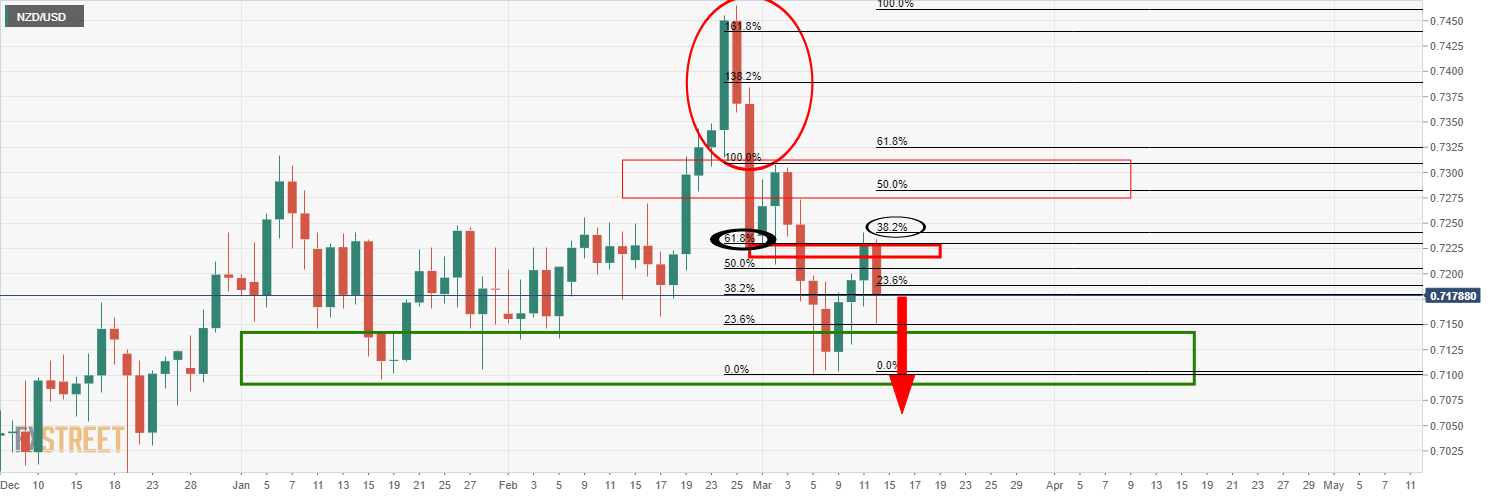
The daily bearish engulfing has led to the pair dropping and correcting to a 38.2% Fibonacci retracement level which is significant enough to ow expect a downside continuation to test deeper into the demand zone.
Traders will be on the lookout for bearish conditions on the 4-hour time frame for a swing trading opportunity.
Live market, 1-hour chart
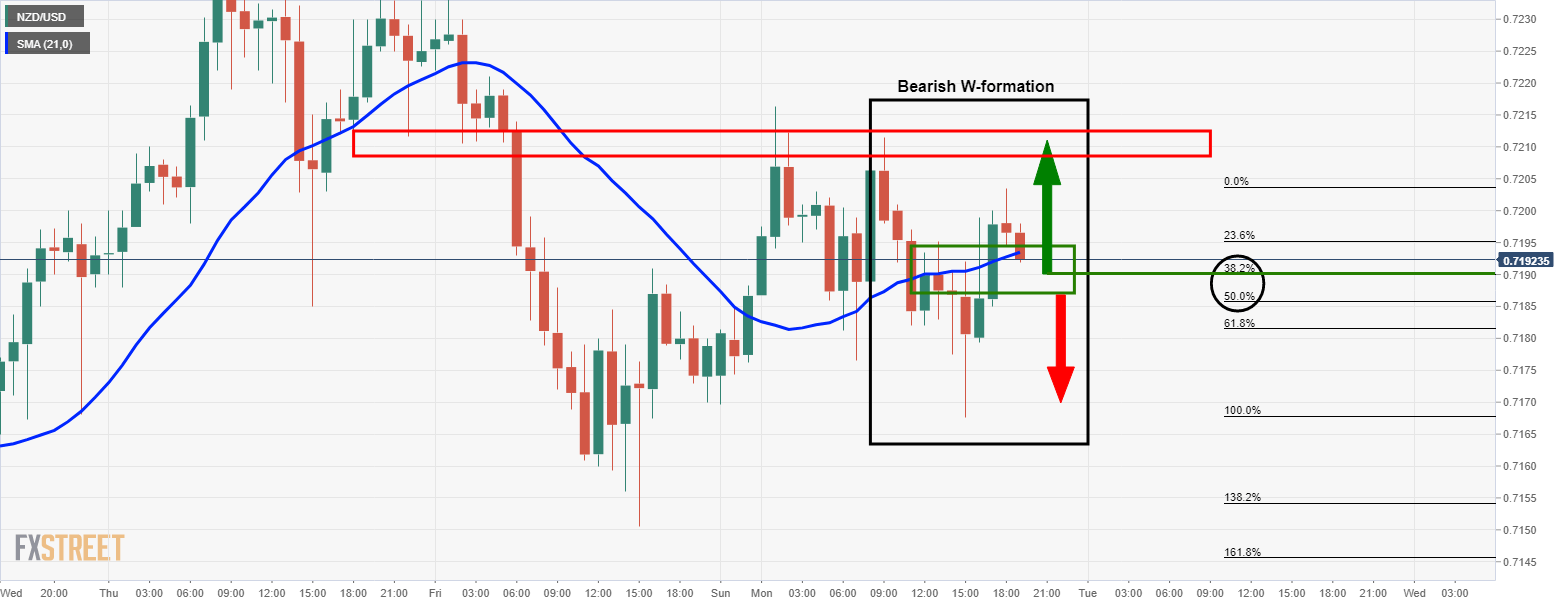
From an hour perspective, bears will want to see the price break below the 50% mean reversion area within the bearish W-formation.
In doing so, the bias will be firmly with the bears once again, reverting back to the daily chart's bearish bias.