AUD/USD Price Analysis: Recapturing 0.7188 is critical for further upside
- AUD/USD ranges within a symmetrical triangle on the hourly chart.
- A bunch of healthy resistances await en route 0.7200.
- Focus remains on US-China trade updates, US data.
AUD/USD moves back and forth in a familiar range around 0.7175 region in the European session, unable to benefit from the risk-on market mood induced by the US-China trade optimism and broad US dollar pullback.
The stalled upside in the S&P 500 futures combined with higher US Treasury yields seems to cap the upbeat momentum in the spot.
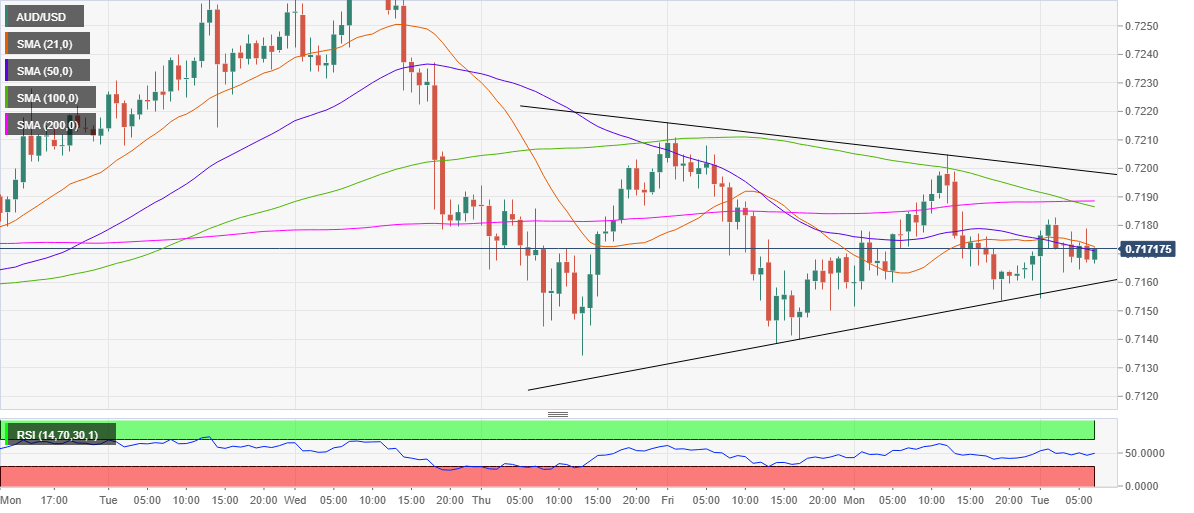
Looking at it technically, the aussie extends its range play within a four-day long symmetrical triangle formation on the hourly chart, awaiting a breakout on either side, with hourly Relative Strength Index (RSI) trading flat just below the midline.
Over the last hours, the spot is struggling to move convincingly above the 0.7173 level, the confluence of the 21 and 50-hourly Simple Moving Averages (HMA).
An hourly close above that level would trigger a fresh rise towards the next barrier at 0.7188, which is the convergence of the 200 and 100-HMAs.
Acceptance above the latter will open doors towards the 0.7200 mark.
Alternatively, the sellers target the rising trendline support at 0.7159, a below which the pattern will get confirmed.
A symmetrical triangle bearish break could call for a test of 0.7100 levels.
AUD/USD: Hourly chart
AUD/USD: Additional levels