Back
2 Dec 2019
US Dollar Index Technical Analysis: DXY on track to register its worst daily decline in 2.5-months
- DXY starts December with a high volatility bear breakout.
- The 97.70 level seems to be on the bears’ radar in the medium term.
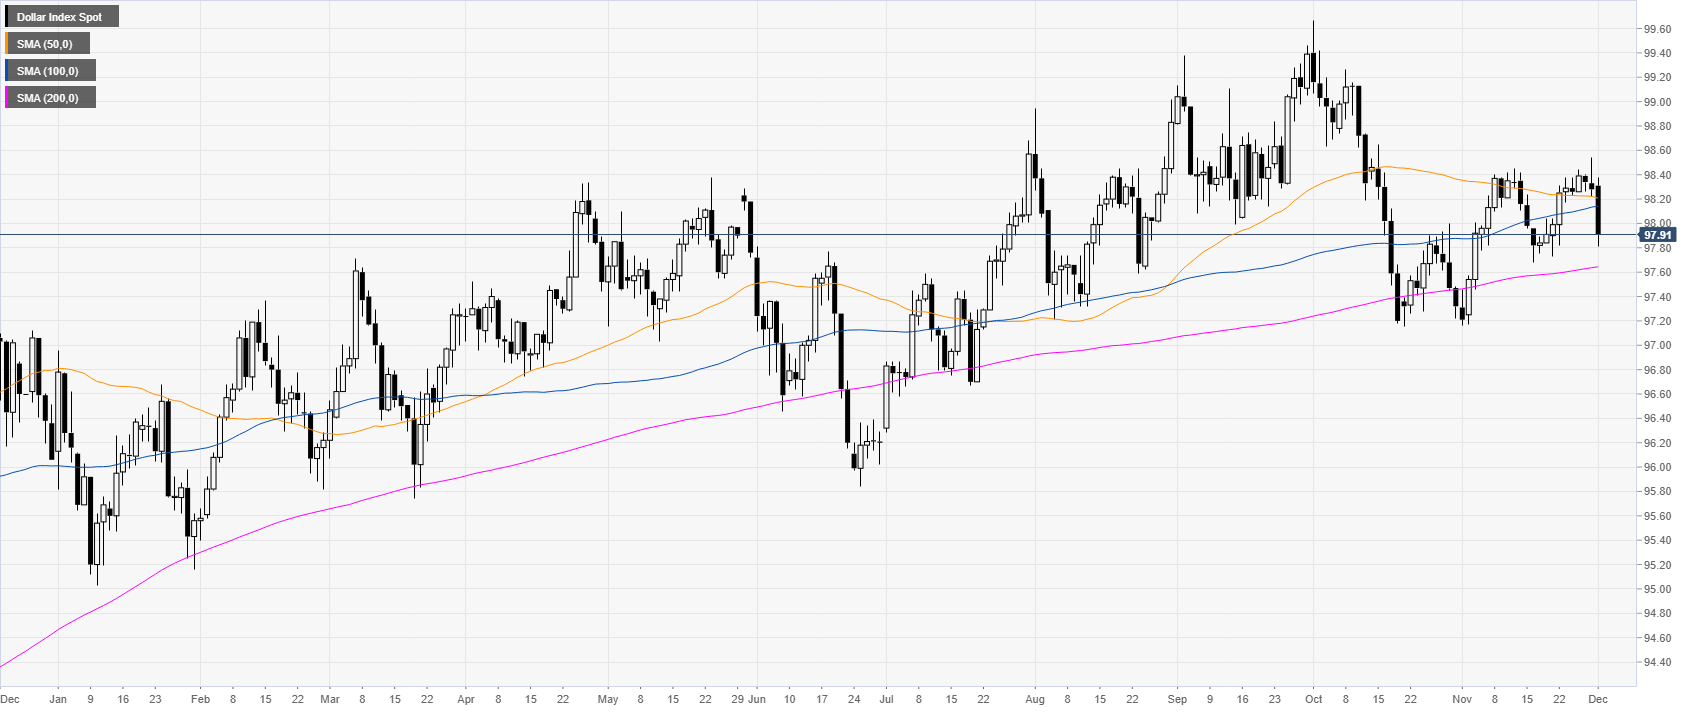
DXY daily chart
DXY (US Dollar Index) is trading in a bull trend above the 200-day simple moving averages (DMA). However, this Monday, the greenback is on track to record its worst daily decline in the last 2.5 months.
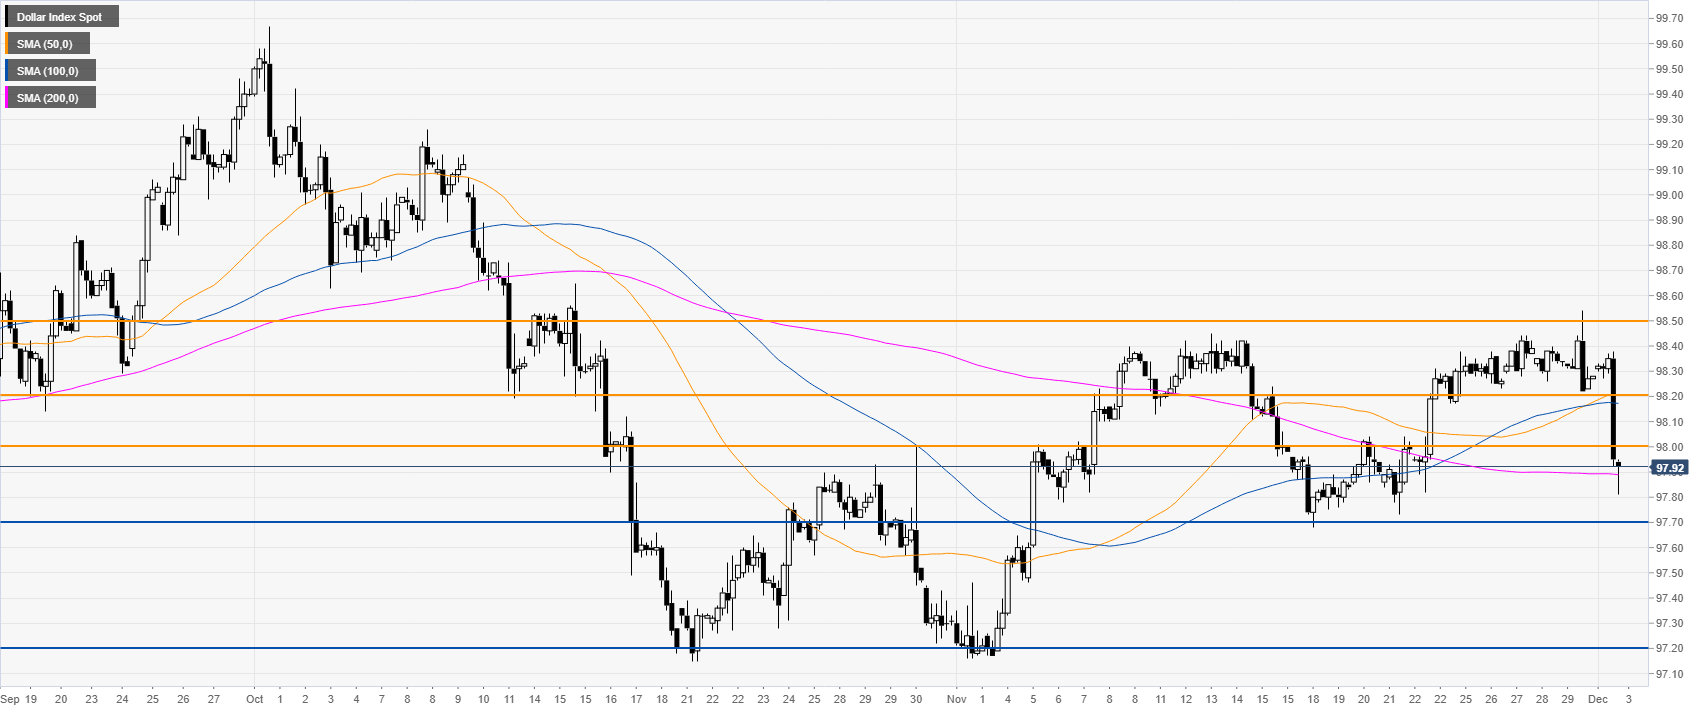
DXY four-hour chart
DXY had a strong bearish breakout rejecting the 98.50 level. The market is challenging the 200 SMA on the four-hour chart while below the 98.00 handle. The bears seem to have taken control and a dive down to the 97.70 level seems to be on the cards. If this level gets broken to the downside, investors will be looking for a potential drop towards the 97.20 support level.
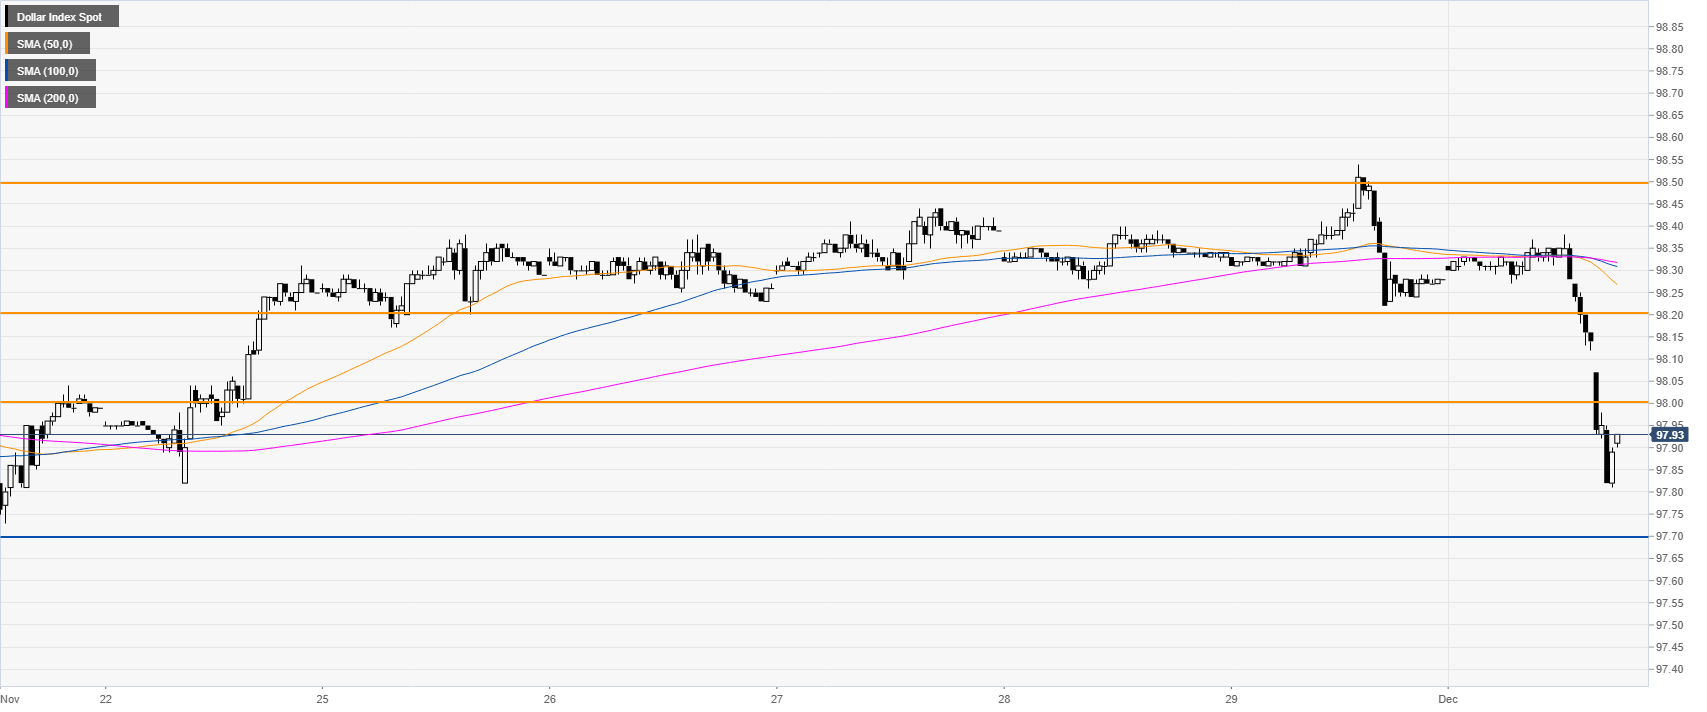
DXY 30-minute chart
The greenback spiked down below its main SMAs, suggesting a bearish momentum in the near term. Resistance can be expected near the 98.00 and 98.20 levels.
Additional key levels