Back
6 Nov 2019
US Dollar Index technical analysis: DXY ends Wednesday parked below the 98.00 figure
- DXY holds onto weekly gains this Wednesday ending the day virtually unchanged.
- The level to beat for bulls is the 98.00 handle.
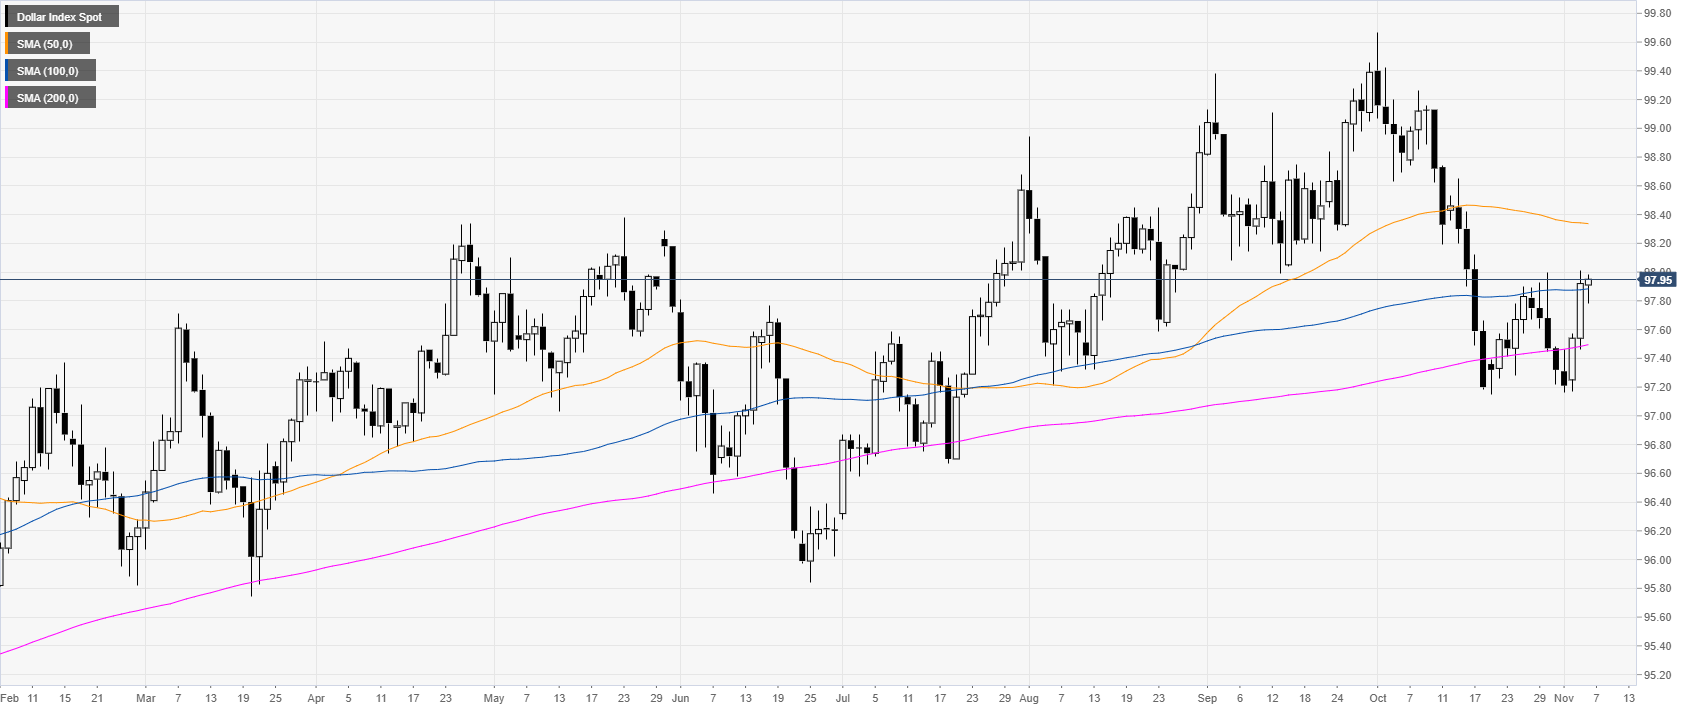
DXY daily chart
DXY (US Dollar Index) is trading in an uptrend above its 100 and 200 DMAs. This Wednesday, the Greenback adds some modest gains ending the day just below the 98.00 handle.
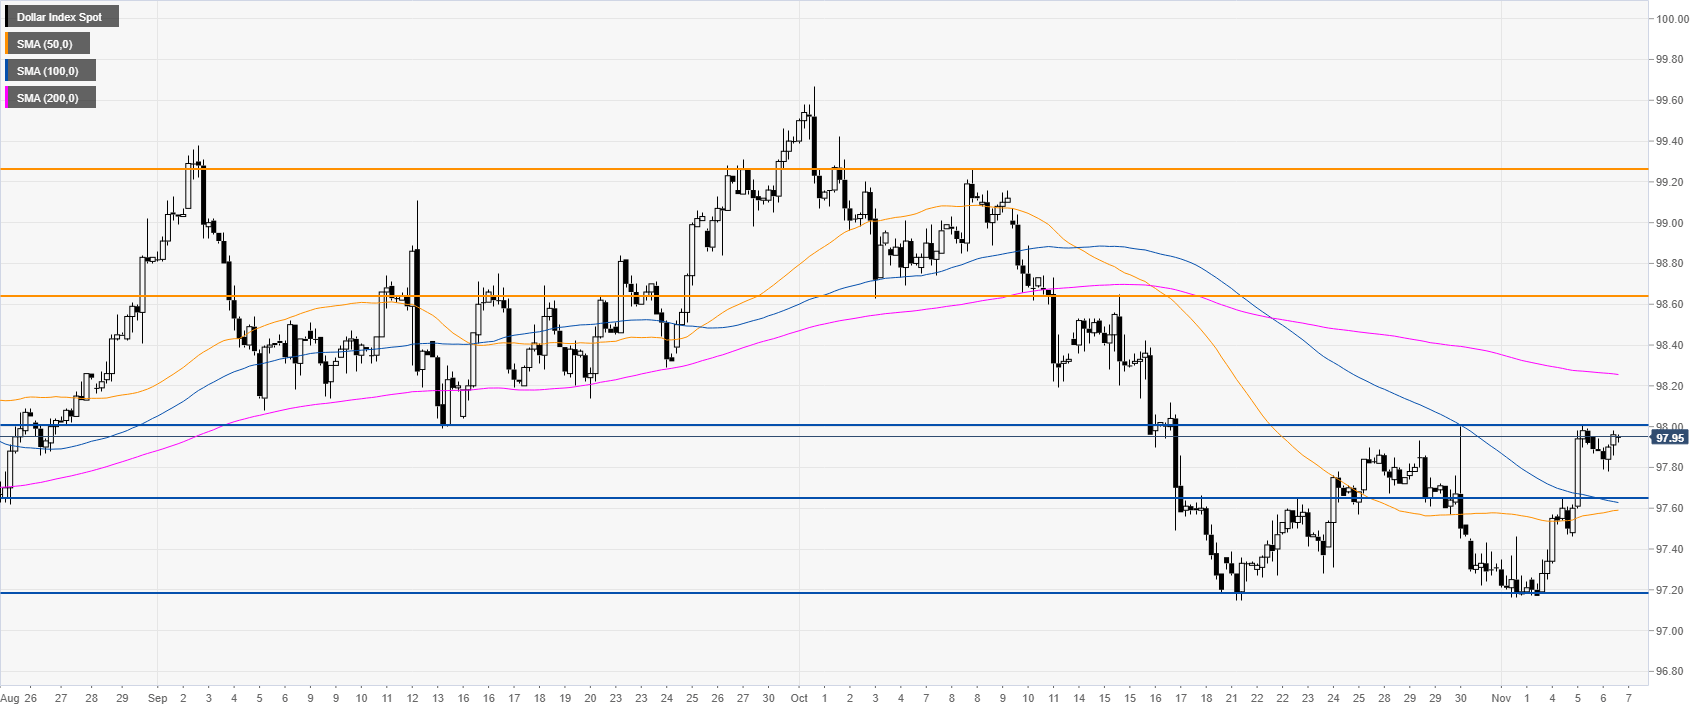
DXY 4-hour chart
The Greenback is trading above the 50 and 100 SMAs after forming a double bottom. A break above the 98.00 resistance can lead to further gains towards the 98.65 and 99.26 resistance levels.
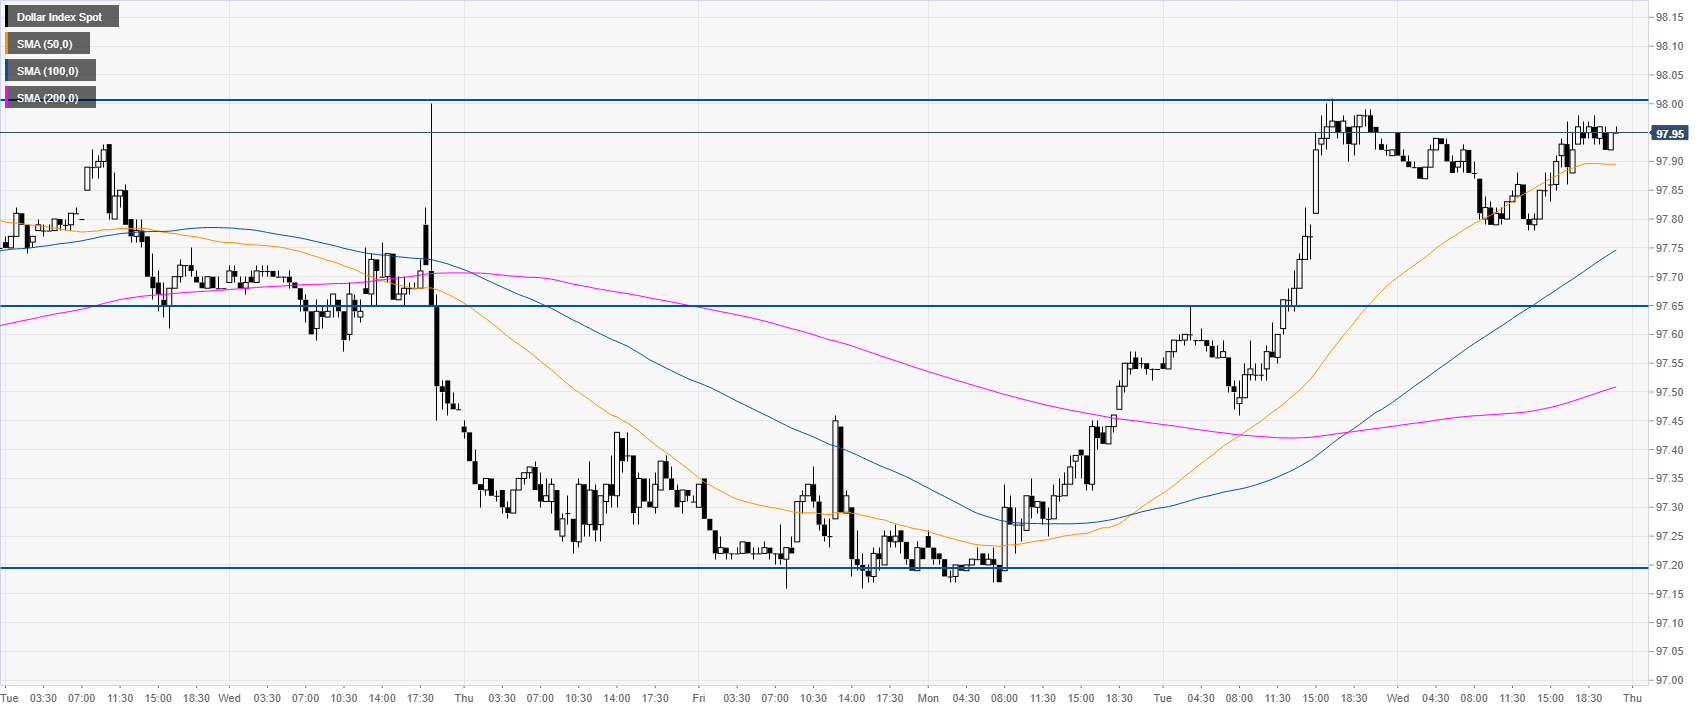
DXY 30-minute chart
DXY is trading above its main SMAs, suggesting bullish momentum in the short term. Support is seen at the 97.65 level. Further down lies the 97.20 support near the monthly lows.
Additional key levels