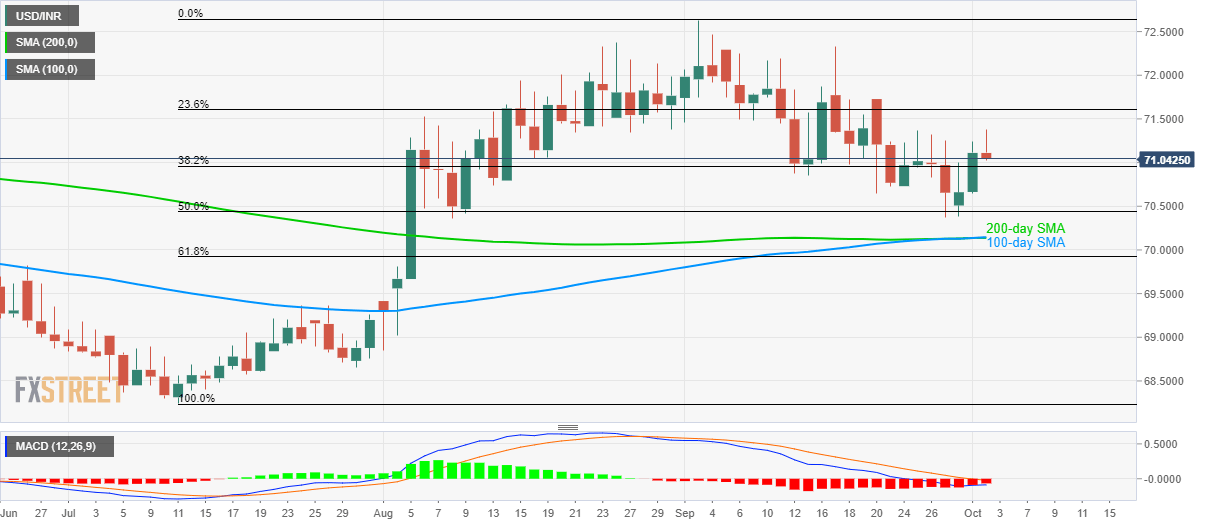
USD/INR technical analysis: Bearish MACD directs sellers to 100/200-day SMA
- USD/INR pulls back from one week high amid bearish MACD.
- 70.36/35 can offer intermediate support before 100/200-day SMA confluence.
Failure to rise past-one week high, coupled with bearish MACD, drags the USD/INR pair down to an intra-day low of 71.03 by the press time of pre-European open on Wednesday.
The pair now aims to revisit 70.36/35 support-zone comprising lows marked in early-August and late-September. However, 70.15/14 confluence including 100 and 200-day simple moving average (SMA) could restrict the pair’s further declines.
Should there be additional weakness below 70.14, late-June and July highs nearing 69.80 and 69.30 will become sellers’ favorites.
If at all buyers ignore the bearish signal from 12-bar moving average convergence and divergence (MACD) and a flash an uptick beyond 71.40 immediate resistance, 71.80 and 72.35 may lure them.
Additionally, pair’s sustained run-up beyond 72.35 could challenge September month high of 72.63 while aiming 73.00 round-figure.
USD/INR daily chart

Trend: pullback expected
