Gold technical analysis: Bulls target 2014 top during further upside, overbought RSI doubts the rise
- A successful break of 2016 top favors the bulls towards targeting 2014 high.
- Overbought RSI can trigger the pullback moves.
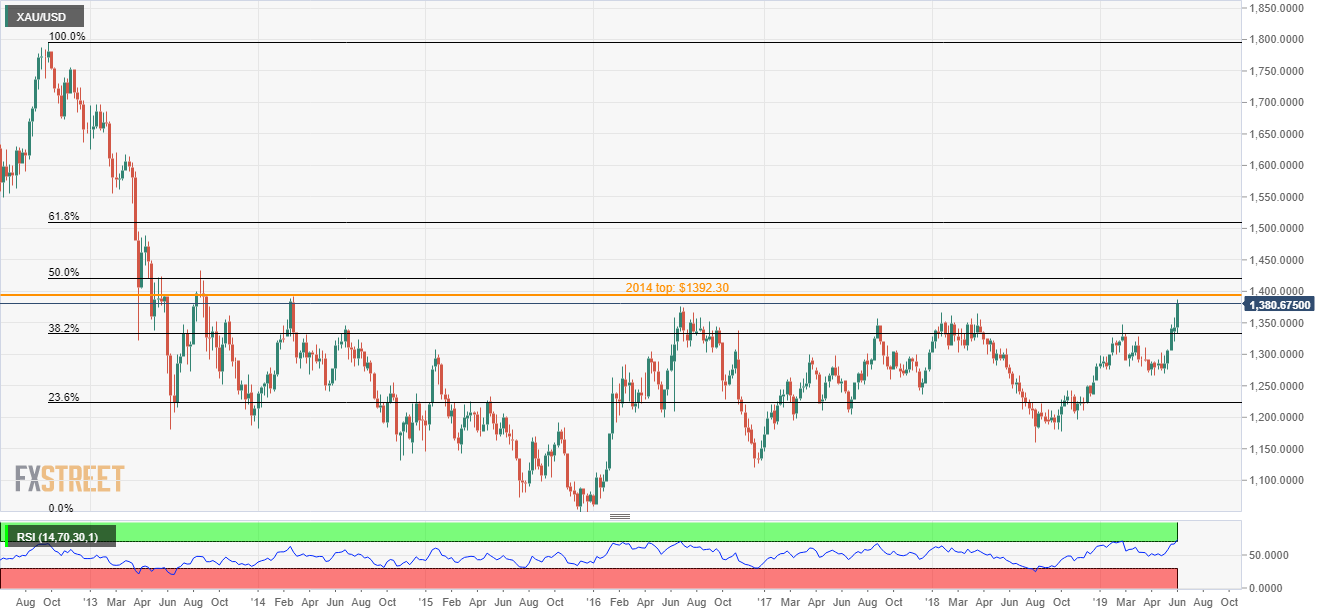
With the global risk-aversion wave fueling the Gold prices to the highest since March 2014, the yellow metal aims for that year top during additional upside as it takes the bids around $1379.65 ahead of the Europe markets open on Thursday.
While $1392.30 is likely immediate cap for the yellow metal, buyers might not refrain from targeting $1,400 round-figure and 50% Fibonacci retracement of 2012-16 downturn, at $1421.22, during further upside.
If at all overbought levels of 14-bar relative strength index (RSI) triggers the bullion’s profit-booking, January 2018 high near $1366 and February month tops around $1346.85 can please short-term sellers.
It should, however, be noted that the quote’s downside past-$1346.85 may diver bears towards 38.2% Fibonacci retracement of $1332.76 rest-point.
Gold: Weekly chart
Trend: Pullback expected