EUR/USD Price Analysis: Trims losses near 1.0700, the bearish outlook remains intact
- EUR/USD trades on a stronger around 1.0700 in Monday’s early European session.
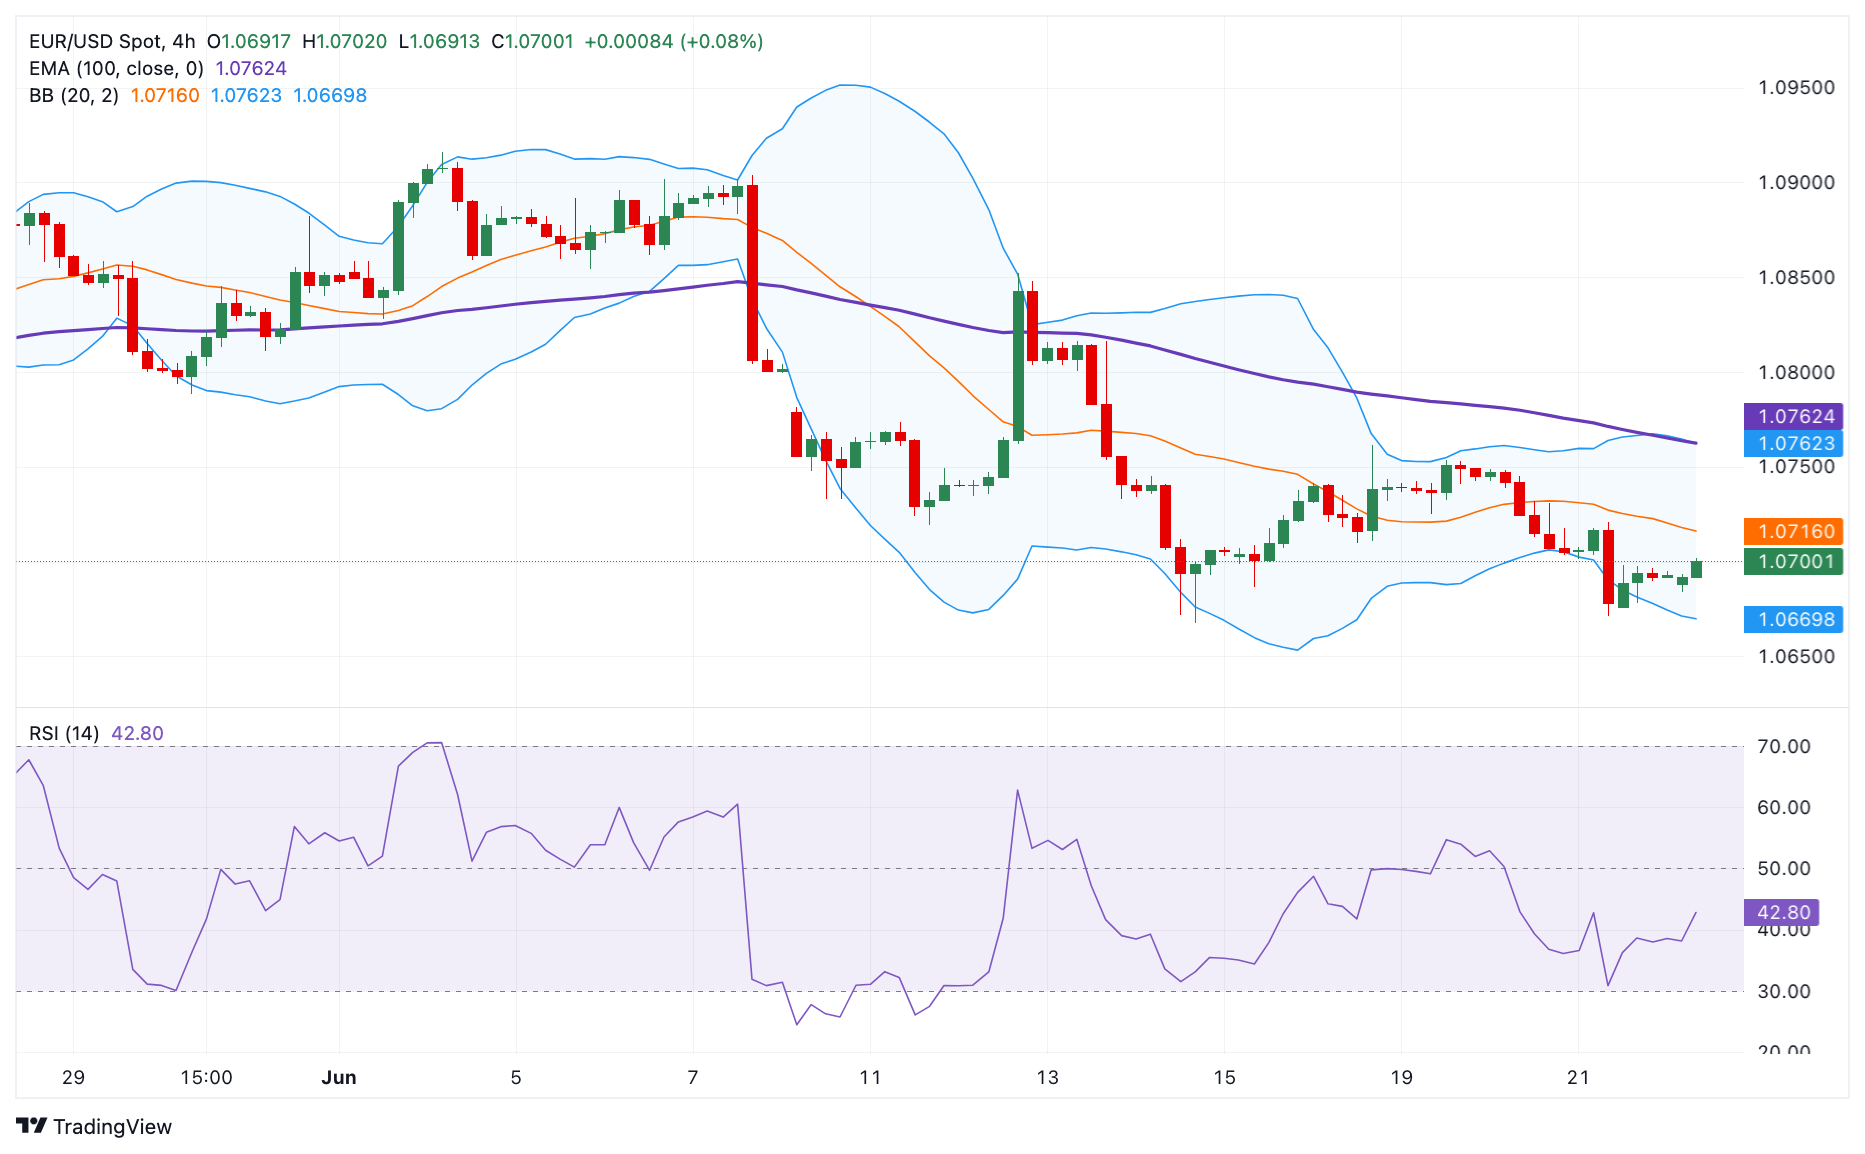
- The pair keeps the negative vibe below the key 100-period EMA, with the bearish RSI indicator.
- The key upside barrier will emerge near 1.0762; 1.0670 acts as an initial support level for the pair.
The EUR/USD pair trims losses near 1.0700 during the early European session on Monday. The upside of the major pair might be limited as investors are concerned about the political uncertainties in the Eurozone, particularly the outcome of a snap election in France. Furthermore, the firmer US Dollar (USD) after the stronger-than-expected US PMIs released on Friday might lift the Greenback and create a headwind for the pair.
Technically, the bearish outlook of EUR/USD remains intact as the major pair holds below the key 100-period Exponential Moving Average (EMA) on the 4-hour chart. The downward momentum is backed by the Relative Strength Index (RSI), which stands in the bearish zone near 40.0, indicating that further downside looks favorable.
The key upside barrier for EUR/USD will emerge near 1.0762, portraying the confluence of the 100-period EMA and the upper boundary of the Bollinger Band. Further north, the next hurdle is seen at 1.0815, a high of June 15. Any follow-through buying will see a rally to 1.0852, a high of June 12.
On the flip side, the lower limit of the Bollinger Band at 1.0670 acts as an initial support level for the major pair. A breach of this level will pave the way to 1.0650, a low of May 1. The additional downside filter to watch is the 1.0600 psychological level.
EUR/USD 4-hour chart