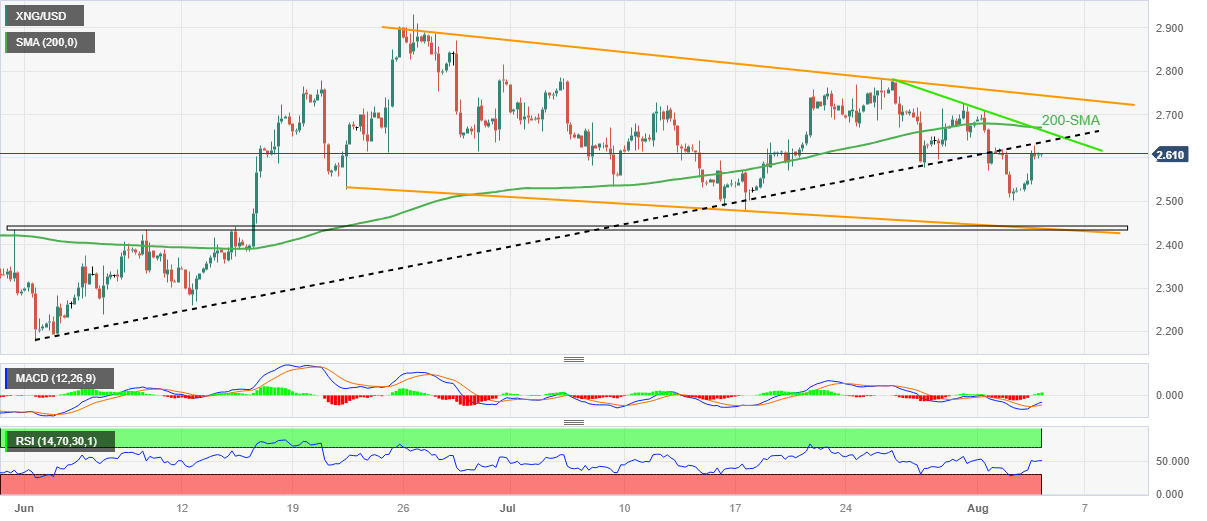
Natural Gas Price Analysis: XNG/USD recaptures $2.60 within six-week-old bearish channel
- Natural Gas Price defends the previous day’s corrective bounce off three-week low within bearish chart formation.
- Two-month-long support-turned-resistance guards immediate recovery of XNG/USD.
- Convergence of weekly resistance line, 200-SMA adds to the upside fitlers.
- Natural Gas sellers may find it difficult to break $2.43 support confluence.
Natural Gas Price (XNG/USD) pares weekly losses around $2.61 during early Friday as markets consolidate ahead of the US employment report for July. In doing so, the XNG/USD extends the previous day’s recovery from the lowest level in three weeks while staying within a 1.5-month-long descending trend channel.
It’s worth noting, however, that the recently bullish MACD signals and the upbeat RSI, as well as the US Dollar’s retreat from a multi-day high, allowed the Natural Gas Price to recover.
Even so, the previous support line from early June guards immediate recovery of the XNG/USD near $2.64.
Following that, a convergence of the 200-SMA and a one-week-old faling trend line, close to $2.67 could challenge the Natural Gas buyers.
It’s worth noting, however, that the XNG/USD bulls must defy the bearish channel by crossing the $2.75 hurdle to restore the market’s confidence.
On the contrary, pullback moves may aim for the latest swing low of around $2.50. However, a convergence of the nine-week-old horizontal support zone joins the aforementioned bearish channel’s lower line to around $2.43 while offering a major challenge to the Natural Gas sellers.
Natural Gas Price: Four-hour chart
Trend: Limited upside expected